
Paula Paz, Terra-i team member, explored different data sources (Google Earth and Landsat Viewer) to validate the Terra-i system, identify the advantages and disadvantages of each data source and analyze data availability and quality A case study in Caquetá, Colombia was used, where two areas were identified as "hotspots" for changes of vegetation and land use due to anthropogenic activities, as confirmed by Terra-i detections.

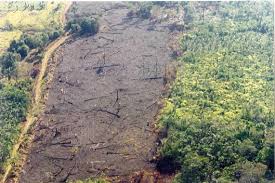
Figure 1. Anthropogenic factors such as the colonization model, illegal mining, logging of trees and the expansion of the agricultural frontier, as a consequence of illicit crop production, are some of the causes of deforestation in the Caquetá study area (Colombia). SOURCE: Natura
Land cover change and land use maps generated by the Terra-i tool provide valuable information to users. These maps are vital in understanding and predicting the effects of anthropogenic interactions on the environment which may extend across local, regional and global scales [1] and are thus crucial for decision-making processes and policy design. For these reasons the generation of spatial information must be consistent and accurate to correctly analyze phenomena such as deforestation.
Therefore, it is important to assess the accuracy of different data sources [2]. There are different methods available to validate satellite data including field corrections which are accurate but time expensive, and less time expensive methods such as the use of imagery with high and/or medium resolution e.g. QuickBird (2.4m) and Landsat (30m).
Methodology
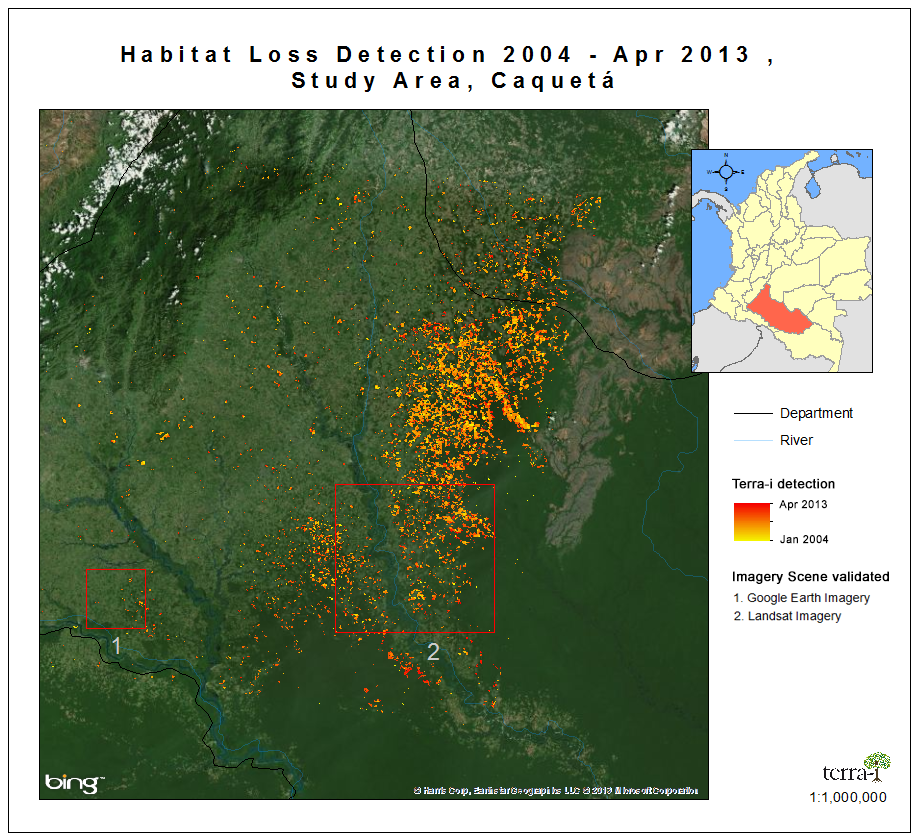
An approach was designed based on the visual interpretation of satellite images (high and/or medium resolution) such as QuickBird and Landsat provide by Google Earth and Landsat Viewer (http://landsatlook.usgs.gov/) respectively in the study area of Caqueta, Colombia (Figure 2). Essentially, the methodology, based on the reference [3], was to visually identify "hotspots" areas of land cover change by exploring high/medium resolution images which correspond to detections identified by the Terra-i system. Further information about the workflow is shown in Figure 3.

Figure 2. Study area with Terra-i detections from January 2004 to April 2013. Red boxes 1 and 2 correspond to the validation area with Google Earth and Landsat Viewer images, respectively.

Figure 3. Workflow methodology
Results
Google Earth Images
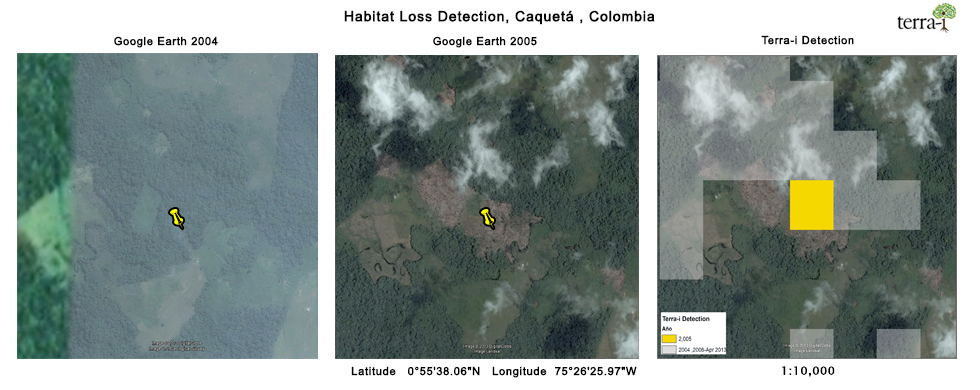
It was concluded that Google Earth was the most successful and accurate method due to the spatial resolution of the Digital Globe QuickBird images which allows accurate identification of changes in vegetation cover, and these changes correlated strongly with Terra-i’s detections.

Figure 4. Hotspot area detection with Google Earth images to assess land cover loss detected by the Terra-i system in 2005.
Using Google Earth as a validation tool has further advantages as it is easily and freely accessible and it allows you to visualize large datasets of high resolution images. However, Google Earth has limited provision of historical data which prevents multi-temporal analysis in impacted regions detected by the Terra-i system. Also, the time series of the Digital Globe images only is only available from 2002 to 2010, making it impossible to validate the most recent Terra-i detections (2011, 2012 and 2013). Finally, the high resolution imagery provided by Google Earth could be expensive if a user is planning to analyze it on a remote server or using GIS software.
Landsat Images
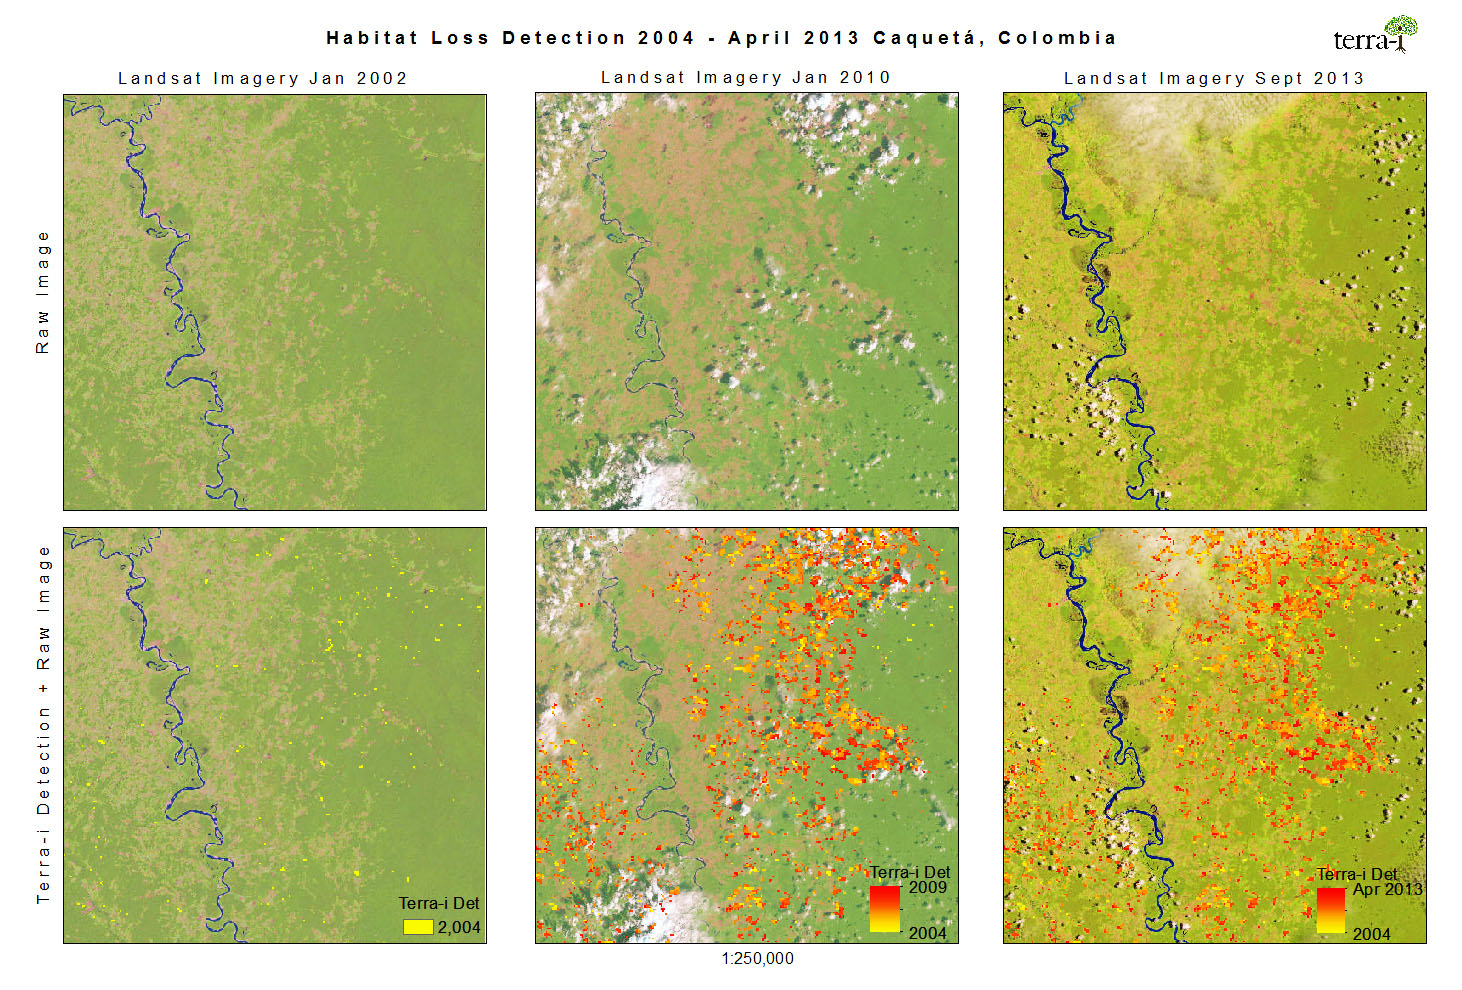
The Landsat Viewer tool allows users to select Landsat images to identify the land cover changes. This tool has images with a 30 m spatial resolution and they are displayed in the viewer using the band composition 5, 4, 3 which is exposed as a "natural" image of the surface [4].
Using the data from coarse resolution sensors (10-60m) such as Landsat is a well-known data source used by researchers to map land cover changes. Its spatial resolution level is high enough to identify land use changes and its 35 year data record allows users to perform multi-temporal analysis, thus providing an alternative method to validate Terra-i system detections.
However, the image quality is lower than Quickbird due to cloud presence as well as the banding in Landsat 7 ETM+ imagery since May 2003. Furthermore, the spatial resolution (30 meters) doesn’t allow users to directly identify the cause of the change, instead only algorithms are used to classify it.

Figure 5. Hotspot area detection with Landsat imagery shows how Terra-i detections follows similar patterns of disturbance events.
In conclusion, the validation method with visual interpretation of high/middle resolution images should use data sources with high temporal and spatial resolution, also the image quality must be cataloged well, which allows an accurate hotspots area detection of land cover and land use change.
Bibliography
[1] Clark , et al, A scalable approach to mapping annual land cover at 250 m using MODIS time series data: A case study in the Dry Chaco ecoregion of South America, Remote Sensing of Environment 114 (2010) 2816–2832, 2010 , [Online http://www.desertificacion.gob.ar/wp-content/uploads/2013/01/Clarketal2010_RSE.pdf]
[2] Olofsson , et al., A global landcover validation data set, part I: fundamental design principles, International Journal of Remote Sensing, 33:18, 5768-5788, 2012, [Online http://www.tandfonline.com/doi/abs/10.1080/01431161.2012.674230#.UjcZPz9F1Fg]
[3] Bontemps, et al, Operational Service Demonstration For Global Land- Cover Mapping: The GlobCover And GlobCorine Experiences For 2005-2009. En Giri y Weng y, Remote Sensing Of Land Use And Land Cover: Principles and Aplication (pp. 243-264). CRC Press.
[4] USGS, Landsat Missions, [Online http://landsat.usgs.gov/LandsatLookImages.php]
[5] Knorn, J., et al., Land cover mapping of large areas using chain classification of neighboring Landsat satellite images, Remote Sensing of Environment (2009).

The Terra-i team together with CRS El Salvador under the Raices project carried out a virtual workshop through the teams platform to technicians from the Ministry of Environment and Natural Resources, CARITAS, Universidad El Salvador, CENTA, about the Mapping of land cover using remote sensors and open source tools such as GEE, SEPAL and QGIS- Plugin Semi Automatic Classification.

Near real-time vegetation loss detection in Southwestern Ethiopia: calibration, validation, and implementation of the Terra-i system

The Alliance of Bioversity International and the International Center for Tropical Agriculture (CIAT) (the Alliance) conducted a training for local stakeholders on the use of Terra-i as part of the collaboration with the Netherlands Development Organisation – SNV in the Coffee Agroforestry and Forest Enhancement for REDD+ (CAFÉ-REDD) Project.


From May 8-12, 2017, the Terra-i team, together with staff from the DGOTA of Peru's Ministry of Environment, carried out the first field validation of vegetative land cover changes detected during Terra-i monitoring for 2016 and 2017, using the technology UAV. This work was carried out under the framework of the project “Sustainable Amazonian Landscapes”. The team carried out over-flights with a Phantom 3 advanced rotor drone and a fixed-wing Ebee drone in seven townships of Yurimaguas. The objective of this work was to recognize the dynamics of land cover and land use changes in the region while at the same time to validate the accuracy of the detections of forest loss being monitored by Terra-i in Yurimaguas.

The Terra-i team has worked hard on renovating Terra-i’s website since early this year. A set of new features on the website provides interactive contents and facilitates adaptation to the mobile devices of our users. The fresh website was developed using the latest update of an open-source, Java-based web system, Magnolia CMS 5.4.4. This update was customized to add different categories of interaction such as news, vegetation cover changes, and information, among others.

Globally more than 1 billion people depend on forests for their livelihoods. Forests play a crucial role in climate regulation, ecosystem services provision and regulation, water supply, carbon storage and many other functions that support biodiversity. Currently the global rate of deforestation is substantial, and there is a growing need for timely, spatially explicit data that flag natural vegetation changes due to human activities.

The latest update of Terra-i has been used with the Co$ting Nature ecosystem services assessment tool to understand the impacts of recent forest loss in Colombia on biodiversity and ecosystem services.

During the 1st and 12th of June 2015, the Terra-i team, together with the Instituto de Investigaciones de la Amazonía Peruana (IIAP) and the Universidad Nacional Agraria La Molina (VLIR-UNALM), conducted the second field validation of the data produced by the Terra-I system. This time, the study area was the Yurimaguas district, Alto Amazonas province, Loreto region (Peru). We used information on populated places, main roads, rivers and information on land cover changes detected for 2013, 2014 and 2015 to define the 65 sampling points (or Terra-I pixels) for the validation process (Figure 1).