

New data available for download


Check our download section, you'll find all our new data fresh out of the oven. The data will be updated every 3 months in order to fulfill the purpose of being an early warning system that allows environmental authorities to make decisions on time and set priorities for conservation.
Check our download section, you'll find all our new data fresh out of the oven. The data will be updated every 3 months in order to fulfill the purpose of being an early warning system that allows environmental authorities to make decisions on time and set priorities for conservation.
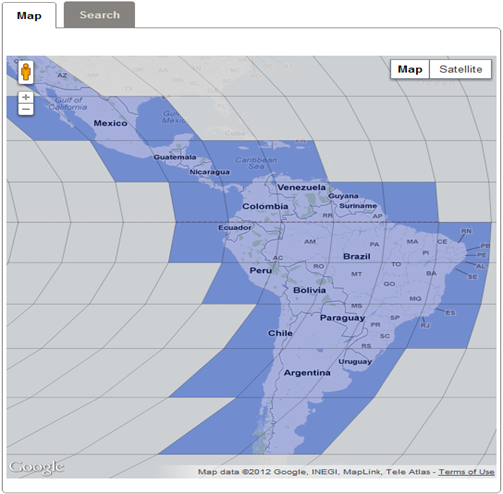
The data are available in compressed ascii grids. You can download a grid for each individual 16-day period or in a cumulative annual manner (from January 1 to December 31). Latin America has been split into different tiles with the same extent and ID as the MODIS tiles. Terra-i spatial resolution is the same as the NDVI (Normalized Difference Vegetation Index) vegetation index from the MODIS product MOD13Q1 and is about 250m.
The data available are classified into three different products. The detections product provides the Terra-i detections that have likely been caused by human actions. The floods product provides the Terra-i detections that have likely been caused by floods or new dams. Finally the increase product provides the Terra-i detections that were due to an abnormal increase of the vegetation index (that could be the result of reforestation but also of the implementation of new irrigation systems in dry areas).
The meanings of the raster values are the following:
• No Data (-9999) : The pixel was not analyzed. A pixel may not be analyzed for two different reasons: Firstly, because it is located within a water body such as lakes and rivers, and secondly, because there was more than 70% of bad quality data (mainly due to cloud cover) between 2000 and 2004.
• 0 : No change was detected within this pixel
• 1 – 353 : The Julian day when the pixel was detected as converted. If you find the value 49 within the raster for the year 2004 it means that the pixel was detected as converted the 18th of February 2004.
If you have questions about our data, please don’t hesitate to contact us!


The Terra-i team together with CRS El Salvador under the Raices project carried out a virtual workshop through the teams platform to technicians from the Ministry of Environment and Natural Resources, CARITAS, Universidad El Salvador, CENTA, about the Mapping of land cover using remote sensors and open source tools such as GEE, SEPAL and QGIS- Plugin Semi Automatic Classification.


Near real-time vegetation loss detection in Southwestern Ethiopia: calibration, validation, and implementation of the Terra-i system


The Alliance of Bioversity International and the International Center for Tropical Agriculture (CIAT) (the Alliance) conducted a training for local stakeholders on the use of Terra-i as part of the collaboration with the Netherlands Development Organisation – SNV in the Coffee Agroforestry and Forest Enhancement for REDD+ (CAFÉ-REDD) Project.


From May 8-12, 2017, the Terra-i team, together with staff from the DGOTA of Peru's Ministry of Environment, carried out the first field validation of vegetative land cover changes detected during Terra-i monitoring for 2016 and 2017, using the technology UAV. This work was carried out under the framework of the project “Sustainable Amazonian Landscapes”. The team carried out over-flights with a Phantom 3 advanced rotor drone and a fixed-wing Ebee drone in seven townships of Yurimaguas. The objective of this work was to recognize the dynamics of land cover and land use changes in the region while at the same time to validate the accuracy of the detections of forest loss being monitored by Terra-i in Yurimaguas.


The Terra-i team has worked hard on renovating Terra-i’s website since early this year. A set of new features on the website provides interactive contents and facilitates adaptation to the mobile devices of our users. The fresh website was developed using the latest update of an open-source, Java-based web system, Magnolia CMS 5.4.4. This update was customized to add different categories of interaction such as news, vegetation cover changes, and information, among others.


Globally more than 1 billion people depend on forests for their livelihoods. Forests play a crucial role in climate regulation, ecosystem services provision and regulation, water supply, carbon storage and many other functions that support biodiversity. Currently the global rate of deforestation is substantial, and there is a growing need for timely, spatially explicit data that flag natural vegetation changes due to human activities.


The latest update of Terra-i has been used with the Co$ting Nature ecosystem services assessment tool to understand the impacts of recent forest loss in Colombia on biodiversity and ecosystem services.


During the 1st and 12th of June 2015, the Terra-i team, together with the Instituto de Investigaciones de la Amazonía Peruana (IIAP) and the Universidad Nacional Agraria La Molina (VLIR-UNALM), conducted the second field validation of the data produced by the Terra-I system. This time, the study area was the Yurimaguas district, Alto Amazonas province, Loreto region (Peru). We used information on populated places, main roads, rivers and information on land cover changes detected for 2013, 2014 and 2015 to define the 65 sampling points (or Terra-I pixels) for the validation process (Figure 1).