

Tropical Deforestation: An examination of recent anthropogenic forest loss and the provision of ecosystem services on the Island of Borneo


Terra-i detects land cover changes resulting from human activities in near real time, producing updates every 16 days. Currently, the system runs for the whole of Latin America, however, I was granted permission to use Terra-i data collected for the island of Borneo in an independent geographical study produced for a final year dissertation at King's College London.
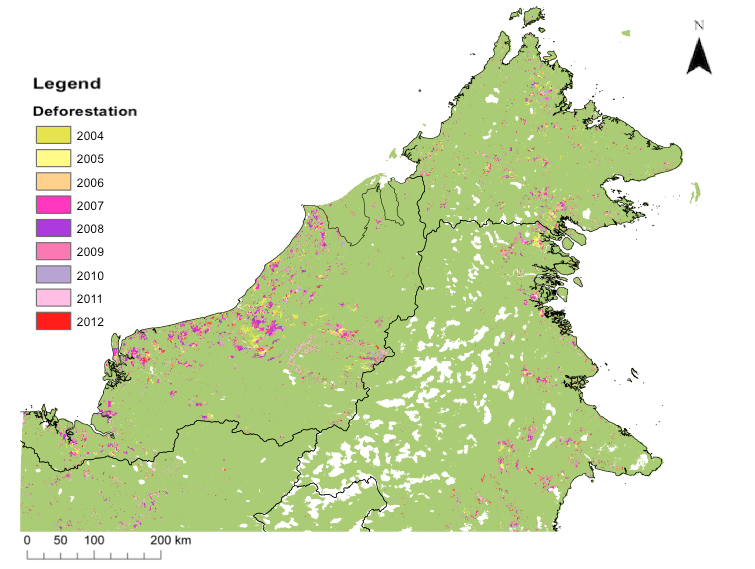
Figure 1. Terra-i forest loss data on the island of Borneo
The aim of the project was to examine the spatio-temporal distribution of tropical forest loss across the northern states of Borneo, in relation to the relative abundance of important ecosystem services. I used the Terra-i data and GIS systems such as SAGAGIS and ArcMap to visually demonstrate the spatio-temporal patterns of deforestation across the study area.
An initial examination of the temporal changes in deforestation was conducted, demonstrating the changing patterns of deforestation during 2004-2012 (Figure 1). Analysis of the Terra-i data indicated a peak deforestation in 2009, with a steady decline in the average annual deforestation thereafter. The high temporal resolution of Terra-i allows such analysis, clearly demonstrating the growth of deforestation across the study area during this period.
Further investigation of the Terra-i data to examine the spatial patterns of anthropogenic forest loss demonstrated a strong positive correlation between deforestation and proximity to communications (such as roads and rivers). The spatial distribution of recent deforestation in relation to existing oil palm plantations and population centers was also assessed and a positive correlation was observed between proximity to these areas and rate of deforestation. However, in regards to population centers, this relationship was considered weak. Nonetheless, it was concluded that accessibility is an important factor for deforestation as communication networks, infrastructure and plantations provide access to previously remote regions, creating opportunities for deforestation, causing forest loss to expand.
Additional spatial analysis of the abundance of important ecosystem services in the deforested areas was carried out using the Co$tingNature tool (www.policysupport.org/costingnature). By combining Terra-i data with Co$ting Nature , analysis of the potential impacts of deforestation on biodiversity, carbon and water ecosystem services was peformed. The relationship of recent deforestation in relation to the top 12% of these services (Figure 2) was demonstrated and the potential losses to these services as a result of deforestation calculated.
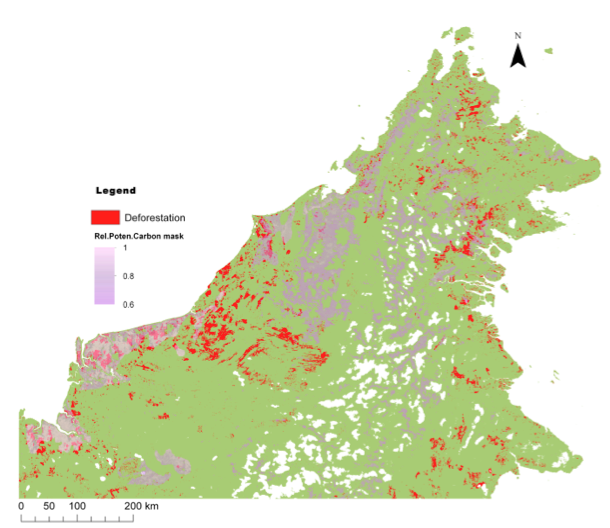
Figure 2. Relationship between recent forest loss and regions yielding the highest 12% of carbon sequestration services
Finally, the Terra-i data was brought into the Co$ting Nature land use change model to develop a land cover change scenario, projecting the current deforestation rate 10, 50 and 100 years into the future. The scenario specified a 100% forest loss for pixels that would be deforested on the basis of the recent Terra-i calculated rates, by regional administrative areas and assigned on the basis of proximity to deforestation fronts and accessibility. It was assumed that protected areas were effectively managed and thus deforestation was excluded from them. A series of maps were produced (Figure 3) illustrating the progressive reduction of Borneo’s rainforest. By 2102, it was projected that mean tree cover across the study area would be have reduced by 24%. Projected forest loss appeared to follow a similar pattern to recent deforestation; expanding laterally from previously deforested areas. The potential effects on ecosystem services being studied were also estimated with Co$ting Nature, with water quality and quantity appearing to be most adversely affected by the projected deforestation.
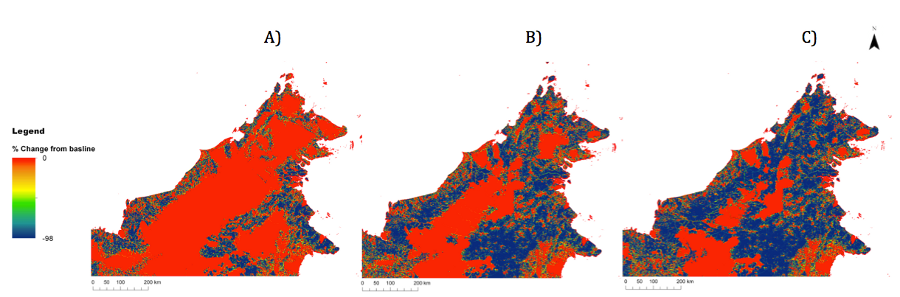
Figure 3. Forest loss projected for A) 25- years B) 50-years and C) 100-years from baseline values measured in 2002.
Deforestation is one of the most important contemporary threats to ecosystem services therefore, so use of Terra-i (www.terra-i.org) in combination with tools like Co$ting Nature (www.policysupport.org) to examine the impacts of recent and projected change is vital to better ecosystem services management.
Contact us for further information about Christina’s work. The Terra-i team invites its users to share other research or initiatives making use of its data. The Terra-i team is grateful to Christina for sharing the details of her work.
Blog post by Christina Ioannou.
Christina Ioannou is an undergraduate student at King’s College London Department of Geography. She recently submitted her final year dissertation in pursuit of a Bachelor of Science in Geography.


IDENTIFICACIÓN DE CAUSAS DE PÉRDIDA DE COBERTURA VEGETAL EN LAS ÁREAS DE INTERVENCIÓN DE LA ACTIVIDAD GOBERNANZA EN ECOSISTEMAS, MEDIOS DE VIDA Y AGUA (USAID/GEMA) EN EL OCCIDENTE DE HONDURAS


MAPEO DE COBERTURAS DE LA TIERRA PARA EL 2017, EN EL OCCIDENTE HONDUREÑO SOBRE ÁREAS DE INTERVENCIÓN DE LA ACTIVIDAD GOBERNANZA EN ECOSISTEMAS, MEDIOS DE VIDA Y AGUA (USAID/GEMA)


CUANTIFICACIÓN DE LA DEFORESTACIÓN EN LAS ÁREAS DE INTERVENCIÓN DE LA ACTIVIDAD GOBERNANZA EN ECOSISTEMAS, MEDIOS DE VIDA Y AGUA (USAID/GEMA) EN EL OCCIDENTE DE HONDURAS


An international team of scientists*, involving entomologists, conservation biologists, agro-ecologists and geographers, has just revealed how on-farm insect biological control can slow the pace of tropical deforestation and avert biodiversity loss on a macro-scale. The case study concerns biological control of the invasive mealybug Phenacoccus manihoti with the introduced host-specific parasitic wasp Anagyrus lopezi in Southeast Asia. The results of this study have just been published in Communications Biology – Nature.


CIAT and the Terra-i team are pleased to announce the publication of a new study in Paraquaria Natural, the most prestigious journal in Paraguay dedicated to biodiversity and the conservation of nature.


New deforestation hotspots point the finger at my favourite fruit I love Terra-i, but today I hate it. A lot. The system uses satellite images to track deforestation in the Amazon in near-realtime. It’s extremely accurate: if a bunch of trees come down somewhere – no matter how remote – Terra-i picks it up. Cool, right? Not today. CIAT’s Louis Reymondin, the system’s chief architect, dropped the bombshell over coffee: it looks as though hundreds of hectares of rainforest in Peru are being trashed by… papaya.


The production of geospatial data related to land-use and land cover changes by governments and civil society organizations has vastly increased during the last decade. Going beyond the valuable information (location, rates and absolute values of changes) provided by these datasets, it is important to have a better understanding of the spatial configurations and composition of the detected change areas at multiple spatial resolutions and time periods. Alejandro Coca-Castro’s research is aiming to map types of spatial deforestation patterns in the Amazon rainforest through the integration of landscape fragmentation metrics and data mining techniques. The research will contribute to the understanding of two deforestation datasets (Terra-i and GFC) and is part of his master dissertation at King’s College London. This blog post highlights Alejandro’s research methodology, preliminary findings and challenges.


Ecuador is recognized as one of the biodiverse hotspots on earth, underneath the Amazon rainforest lies the country’s oil reservoir. With the oil companies and cleared routes come settlers, therefore more and more of this diverse rainforest is being cut down. Since the oil concerns entered the Ecuadorian Amazon 45 years ago, they keep exploring and exploiting the area. The Terra-i detections reveal a total habitat loss of 87,525 Ha, 16,943 Ha (19%) is part of protected areas, between January 2004 and February 2015.