Methodology
The methodology is based on the premise that natural vegetation follows a predictable pattern of changes in greenness from one date to the next brought about by site-specific characteristics and climatic conditions in the preceding days. We use a Bayesian-probability based neural network to learn how the greenness of a given pixel (derived from the MODIS product MOD13Q1) responds to a unit of rainfall (derived from GPM and TRMM daily rainfall product 3b42), then apply the model to identify anomalies in the time series which can be attributed to human activities (i.e. non-natural fluctuations in greenness).
Terra-i is a system for near real time land cover or habitat change monitoring using the MODIS sensor on NASA’s Terra and Aqua platforms. We use machine learning algorithms to bring you maps and analyses of habitat change every 16 days from 2004 to present. You can visualise the data within a geobrowser (web map) environment freely or download the Geographical Information Systems (GIS) files for further analysis (after creating a free account).
Input data
 Terra-i uses data from the Moderate-Resolution Imaging Spectroradiometer (MODIS) sensor which provides images of the entire surface of the globe every 1 to 2 days. This sensor has a high radiometric sensitivity and provides images for 36 bands of the electromagnetic spectrum.
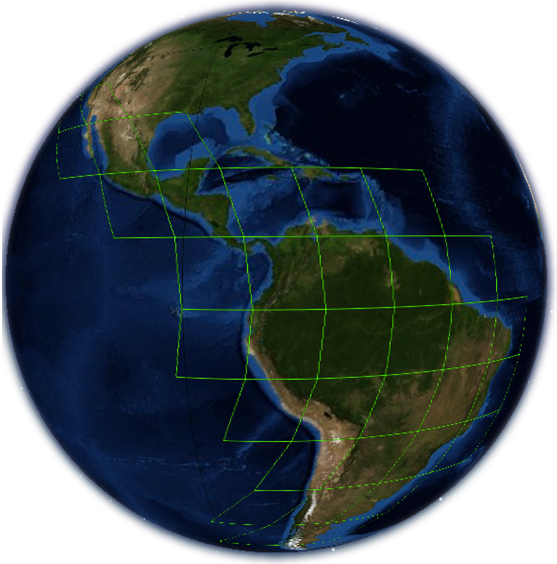
The world is divided into 10 x 10 degree "tiles" or boxes, with a global coverage and a spatial resolution of 250m every 16 days since February 18, 2000 to the current date. For the detection of changes in the habitat, Terra-i uses the MODIS vegetation indices from the product MOD13Q1, and precipitation data from the Tropical Rainfall Measuring Mission (TRMM) sensor.
MODIS vegetation indices data
MODIS vegetation indices data (view)
The vegetat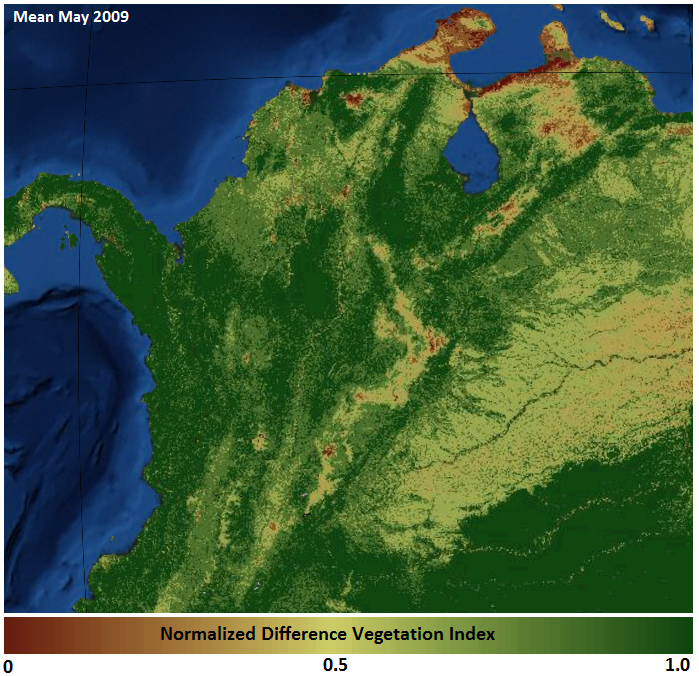 ion indices are designed to provide a permanent and consistent comparison of the temporal and spatial changes of vegetation by responding to the amount of photosynthetically active radiation in a given pixel, to the chlorophyll content, to the leaf area and the structural characteristics of plants. [Huete, Justice y Leeuwen 1999]. The Normalized Difference Vegetation Index (NDVI) [Asrar et al., 1984, Sellers et al., 1992] is an indicator of whether a given area contains live green vegetation or not. The reliability of this index has been shown multiples times, by [Asrar et al., 1984, Sellers et al., 1992] for example. NDVI measures the spectral response of the vegetation. If the vegetation is degraded, it will reflect the blue and even more the red (R) visible spectrum. On the other hand, if the vegetation is healthy, it will reflect the near-infrared spectrum (NIR). Following this principle, many studies [Lloyd, 1990, Kaduk and Heimann, 1996, Moulin et al., 1997, White et al., 1997, Salinas-Zavalaa et al., 2002, Zhang et al., 2003] analyze NDVI time series to derive robust phenology markers such as the start and the end of growing seasons for vegetation.
Terra-i uses NDVI data as well as the quality assessment data provided with a 16 days frequency and a 250m spatial resolution by the MOD13Q1 product.
TRMM precipitation data
 TRMM precipitation data (view)
The Precipitation Radar (PR) aboard the satellite Tropical Rainfall Measuring Mission (TRMM) is the first weather radar designed to measure the vertical structure of tropospheric precipitation in the tropics and subtropics. [Kozu et al., 2001]. Terra-i uses data from the TRMM precipitation sensor with a measurement frequency of 3 hours and a resolution of 28km.
Global Precipitation Measurement (GPM)
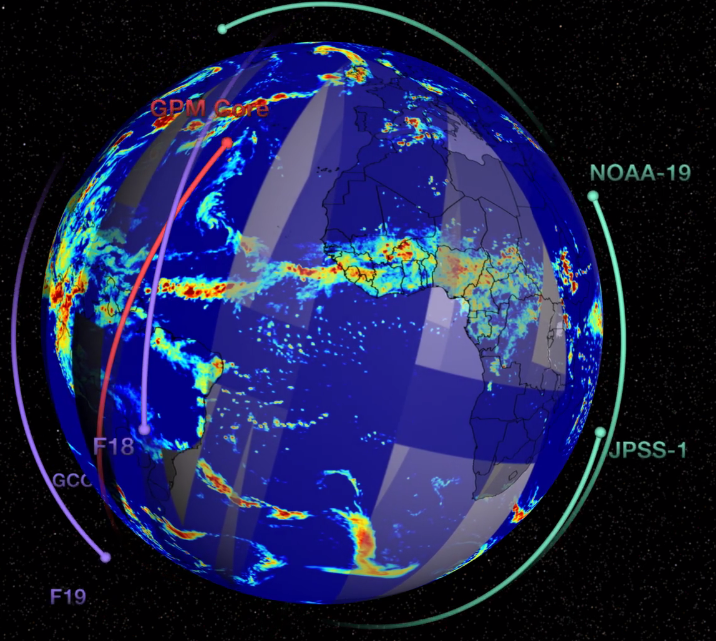
Global Precipitation Measurement (GPM) is an international satellite mission to provide next-generation observations of rain and snow worldwide every three hours. NASA and the Japanese Aerospace Exploration Agency (JAXA) launched the GPM Core Observatory satellite on February 27th, 2014, carrying advanced instruments that set a new standard for precipitation measurements from space. The data they provide is used to unify precipitation measurements made by an international network of partner satellites to quantify when, where, and how much it rains or snows around the world.
The GPM mission contributes to advancing our understanding of Earth's water and energy cycles, improves the forecasting of extreme events that cause natural disasters, and extends current capabilities of using satellite precipitation information to directly benefit society.
Water bodies presence data from MODIS
 Water bodies presence data from MODIS (view)
Terra-i uses the product MOD35 (Cloud Mask) in its final stage of processing to mask the presence of water pixels and thus filter habitat change detections due to flooding and/or increases of water bodies.
Water Mask MOD44W
The new MODIS 250 m land-water mask (Short Name: MOD44W) is an improvement over the existing MODIS Nadir Bidirectional Reflectance Distribution Function (BRDF)-Adjusted Reflectance (NBAR) and MODIS land cover-based global land-water mask (Salomon et al., 2004). The MODIS NBAR and land cover–based mask was itself an improved version of the EOS DEM-based land-water mask (Logan et al., 1999). The new MODIS 250 m mask is primarily created with three different data inputs:
The Shuttle Radar Topography Mission’s (SRTM) Water Body Dataset (SWBD) (Areas between 60° S to 60° N);
The MOD44C, a non-public, 250 m global 16-day composite collection based on 8+ years of Terra MODIS data, and 6+ years of Aqua MODIS data. This data set originally provided the input to produce the Vegetative Cover Conversion, and Vegetative Continuous Fields products (Areas between 60° N to 90° N); and
The MODIS–based Mosaic of Antarctica (MOA), which is a 250 m MODIS level-1b mosaic for Antarctica (Areas within Antarctica between 60° S and 90° S).
Other appropriate and publicly available data sets were also used to supplement the production of the MODIS 250 m land–water mask. Additional details regarding the methodology are available in the User Guide.
This marks the first time that such a global MODIS-SRTM land-water mask is offered publicly to end-users. This data set is provided in the same gridded tile structure that is common to several higher-level MODIS land products.
Output data
Terra-i generates maps of habitat changes every 16 days for each MODIS tile in Latin America from 2004 to the current date.