Visualisation data
Explore our data with the map server interface.
 terra-i
Description
This tool allows the user to visualize and obtain statistical data on decrease detections from 2004 until the most recent data at different levels or target areas such as country, second and third administrative level, protected and indigenous areas or ecosystems. The information is expressed in line and bar graphs that show the time-series of habitat loss alerts within each year as well as its accumulated value, respectively. In addition, the tool allows downloading of: (1) reports* that compile relevant information (rates of change, percentage of analyzed area, the most affected areas, the most affected years, among others); and (2) statistical tables of the target data (administrative levels, protected areas, indigenous areas or ecosystems) in .csv format.
Note: * These reports are currently only available at the country level.
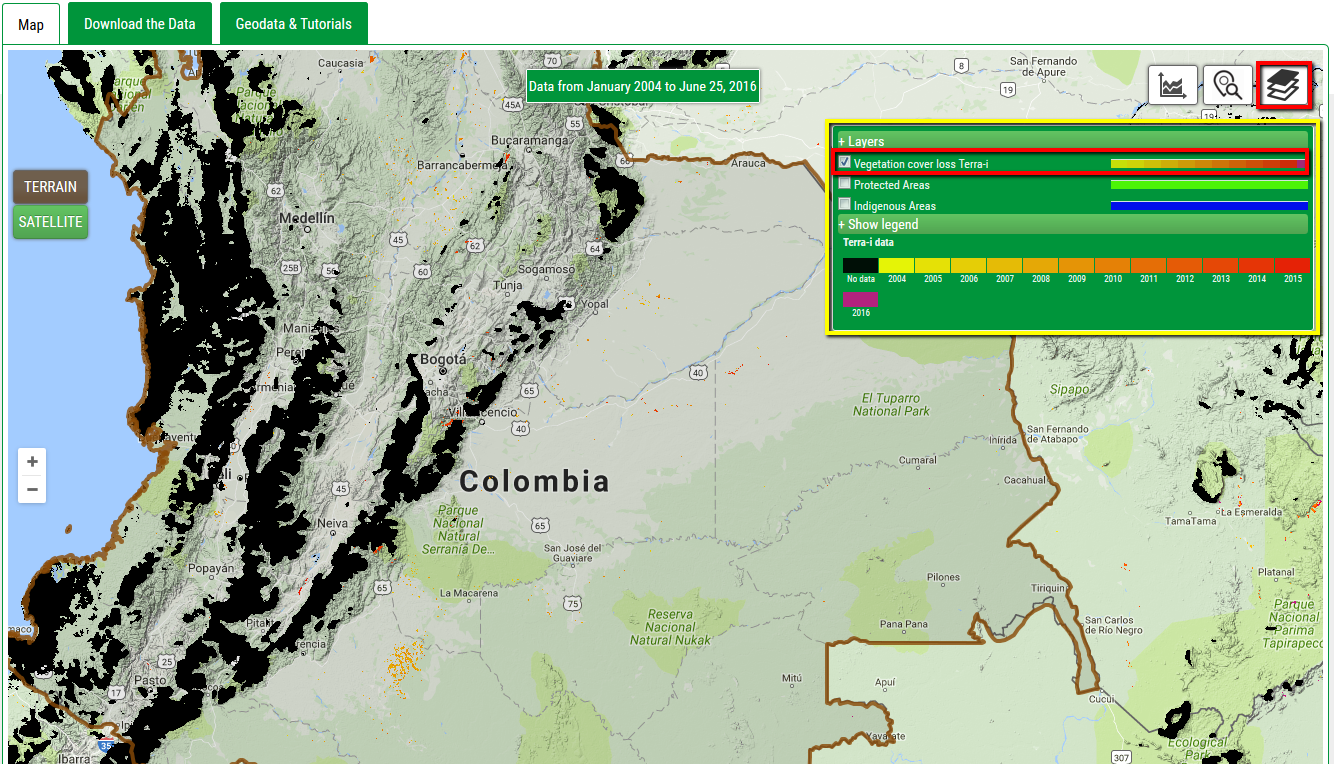
1. Layers button displays a window that allows you to toggle the layers we have available on the map; such as protected areas, indigenous areas. In this section, users now have the option to hide and show the layer of Terra-i data. In addition, the legend of the data is shown.
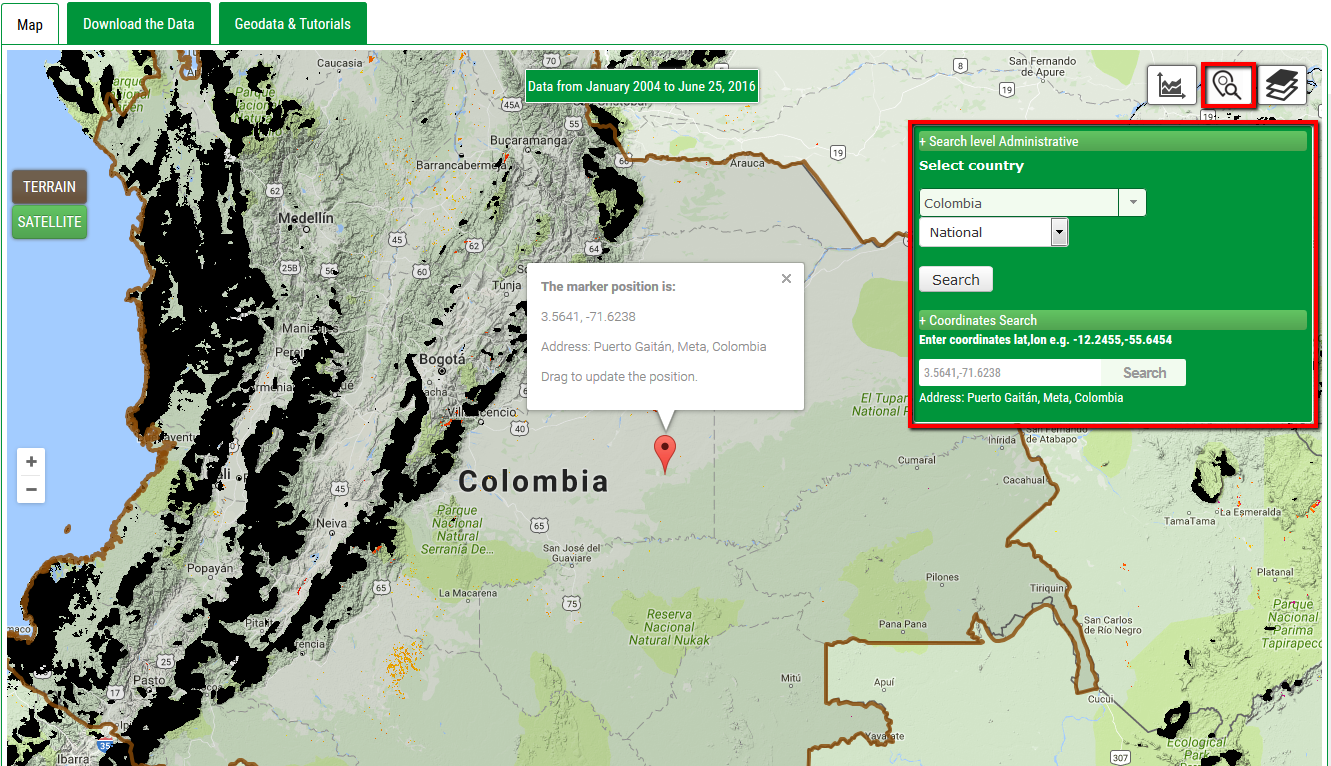
2. The search button displays a window where you can search in different administrative levels (country departments, protected areas, indigenous areas, ecosystems). This control contains a checkbox to activate the polygon search at countries and departments, for the other levels (protected areas, indigenous areas, ecosystems) markers on the map are displayed, clicking on the polygon or the markers you can do the search. Also within this coordinate search option was included, this option displays a marker on the map showing the position (latitude, longitude) and the address.
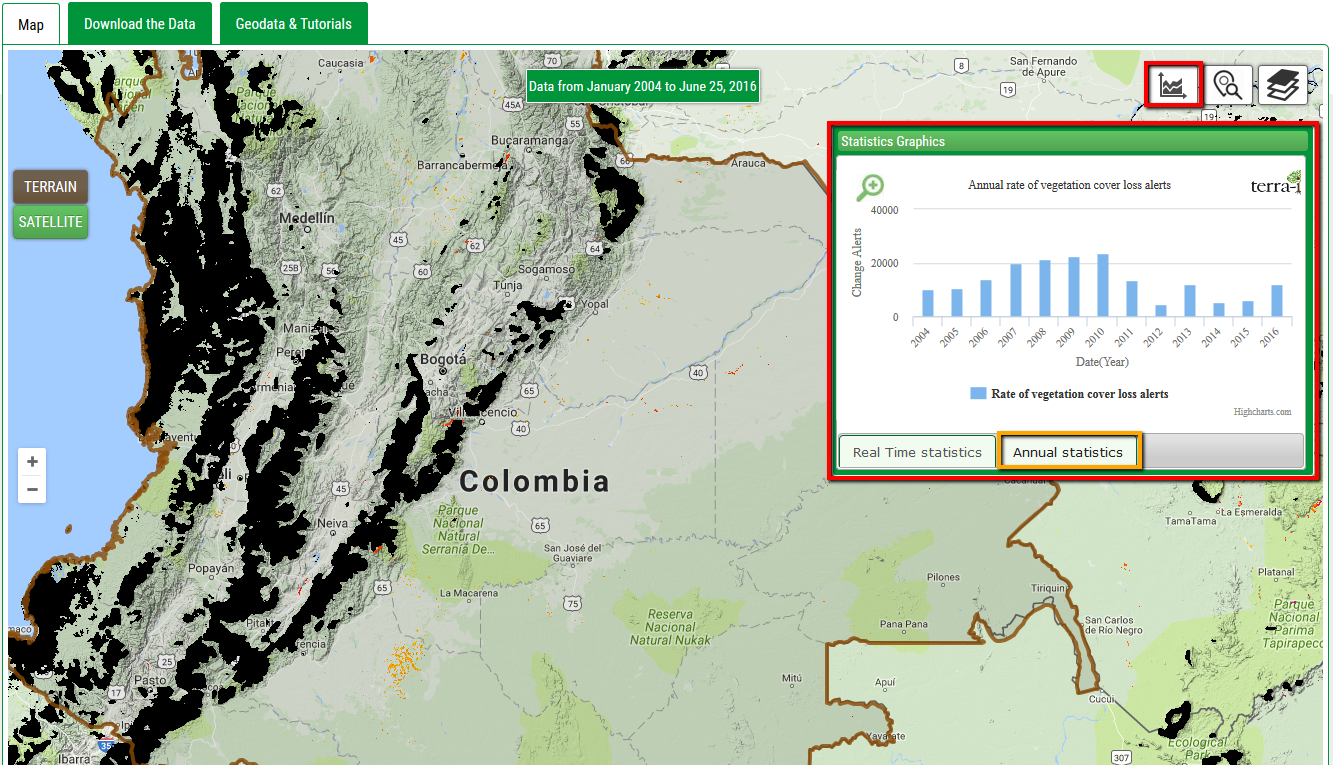
3. The statistics button is activated when a search is performed, and displays a window with dynamic statistical graphics (near real time and annual cover loss). In each graphic is an icon in the top left corner to zoom in on the graph. When zoom is performed at the graphic download icon appears in the top right corner of the chart.
4. The graphic of statistics in near real time has on the right side the legend of the different years as shown in the figure below in the red box. Initially is shown on the graphic the statistics for the last two years. The user can move the mouse over each line on the graphic to display values and toggle the year that you wish to view by clicking on it. When given zoom over the graphic can be made the same events and also download the graphic.
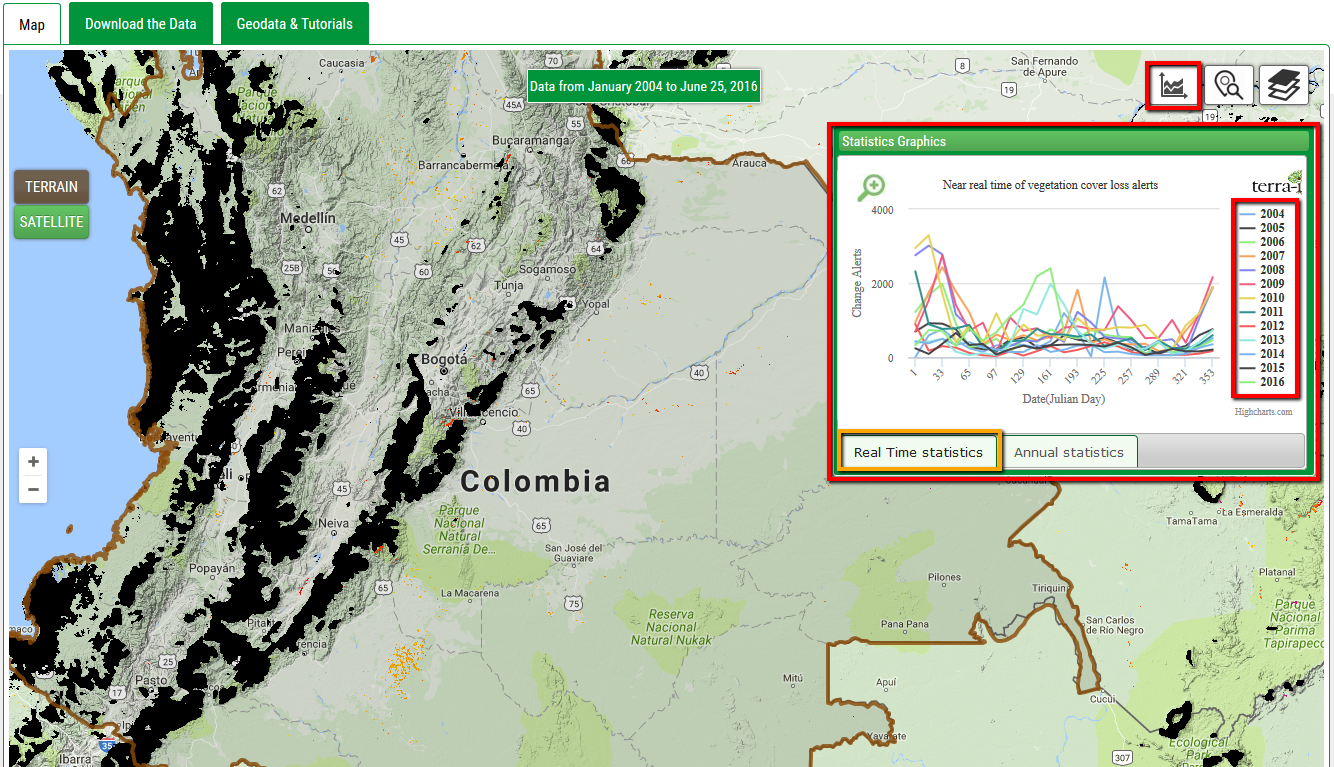
Detailed value information can be obtained placing the mouse cursor over a bar. Bar charts can also be downloaded and/or printed in different image formats (PNG, JPEG, SVG) or as a document (PDF).
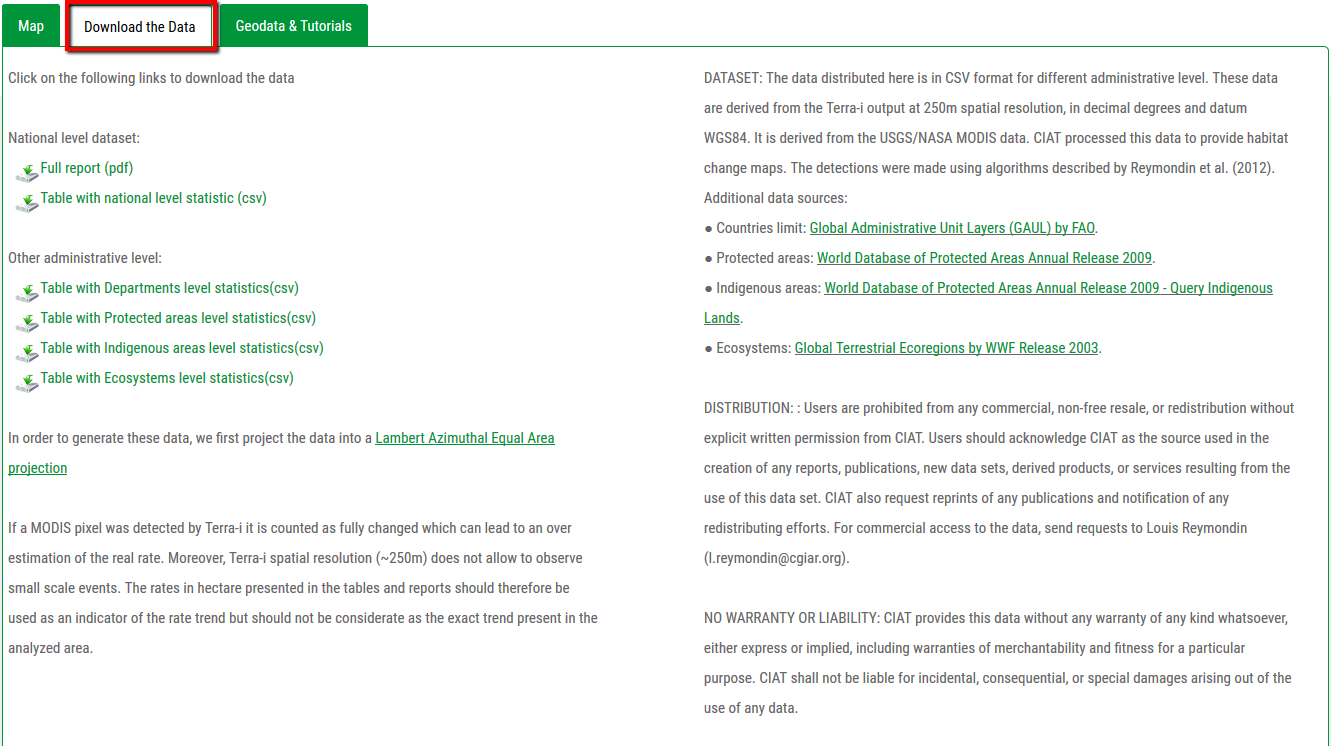
5. This section allows detection data to be downloaded, including a full report (.pdf format). The report contains relevant information for posteriori analyses such as total decrease rates as well as the most affected years by country, second administrative level, ecosystems, and/or protected and indigenous areas. The main aim of these reports is to deliver to the user a synthesis of information extracted from the Terra-i tool.
In addition, the user can download tables in .csv format with information from different levels (national, second and third administrative level, ecosystems, protected and indigenous areas). Each table contains the area change (hectares) by Julian period within the years analyzed as well as the estimate of the annual decrease rate.
Finally, a short text on the distribution and reference sources of the data includes a description, limitations, and recommendations.
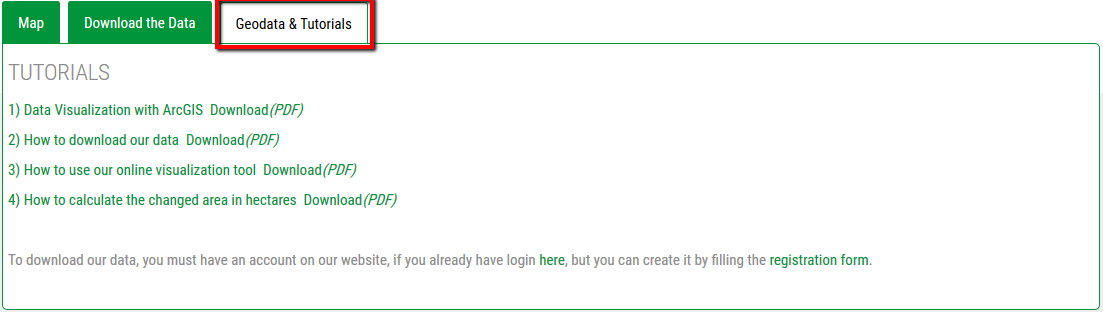
6. Section Geodata and tutorials, you can find manuals on data visualisation with ArcGIS, how to download our data, how to use the visualisation tool and how to calculate the changed area in hectares. Also find a link to go to the download section ASCII data by tile.